Generic method for creating an eikosogram
Usage
eikos(
  y,
  x = NULL,
  data = NULL,
  marginalize = NULL,
  main = "",
  main_size = 16,
  ylabs = TRUE,
  ylab_rot = 0,
  yname_size = 12,
  yvals_size = 12,
  yaxs = TRUE,
  yprobs = NULL,
  yprobs_size = 8,
  xlabs = TRUE,
  xlab_rot = 0,
  xname_size = 12,
  xvals_size = 12,
  xaxs = TRUE,
  xprobs = NULL,
  xprobs_size = 8,
  vertical_xprobs = TRUE,
  ispace = list(bottom = 8, left = 2, top = 2, right = 5),
  legend = FALSE,
  col = NULL,
  bottomcol = "steelblue",
  topcol = "snow2",
  lcol = "black",
  draw = TRUE,
  newpage = TRUE,
  lock_aspect = TRUE
)
Arguments
- y
Either the name of a variable in the data set (eikos.default), or a formula of such variables (eikos.formula).
- x
name(s) of any conditional variable(s) (horizontal axis). Should be null if formula given.
- data
data frame or table
- marginalize
variable(s) to marginalize on, or NULL if none. Marginalized variables still appear in plot.
- main
title of plot
- main_size
font size of title (in points)
- ylabs
logical, whether y labels should appear or not.
- ylab_rot
rotation of y labels
- yname_size
font size of vertical axis names (in points)
- yvals_size
font size of labels for values of y variable (in points)
- yaxs
logical, whether y axis should appear or not.
- yprobs
probabilities to be shown on y-axis. NULL if they should be calculated from the data.
- yprobs_size
font size of labels for horizontal probabilities (in points)
- xlabs
logical, whether x labels should appear or not.
- xlab_rot
rotation of x labels
- xname_size
font size of horizontal axis names (in points)
- xvals_size
font size of labels for values of x variables (in points)
- xaxs
logical, whether x axis should appear or not.
- xprobs
probabilities to be shown on x-axis. NULL if they should be calculated from the data.
- xprobs_size
font size of labels for horizontal probabilities (in points)
- vertical_xprobs
logical, whether probabilities on x axis should be rotated vertically.
- ispace
list of four items (bottom, left, top, right) indicating the margins separating the text around the diagram. Each value is a positive integer giving a measure in "points".
- legend
logical, whether to include legend
- col
a vector of colours to match the response values. If NULL (the default), the colours are constructed as a smooth transition from `bottomcol` to `topcol` via `grDevices::colorRampPalette
- bottomcol
bottom colour
- topcol
top colour
- lcol
colour of lines
- draw
logical, whether to draw eikosogram.
- newpage
logical, whether to draw on a newpage.
- lock_aspect
logical, whether to force entire plot to 1:1 aspect ratio.
Examples
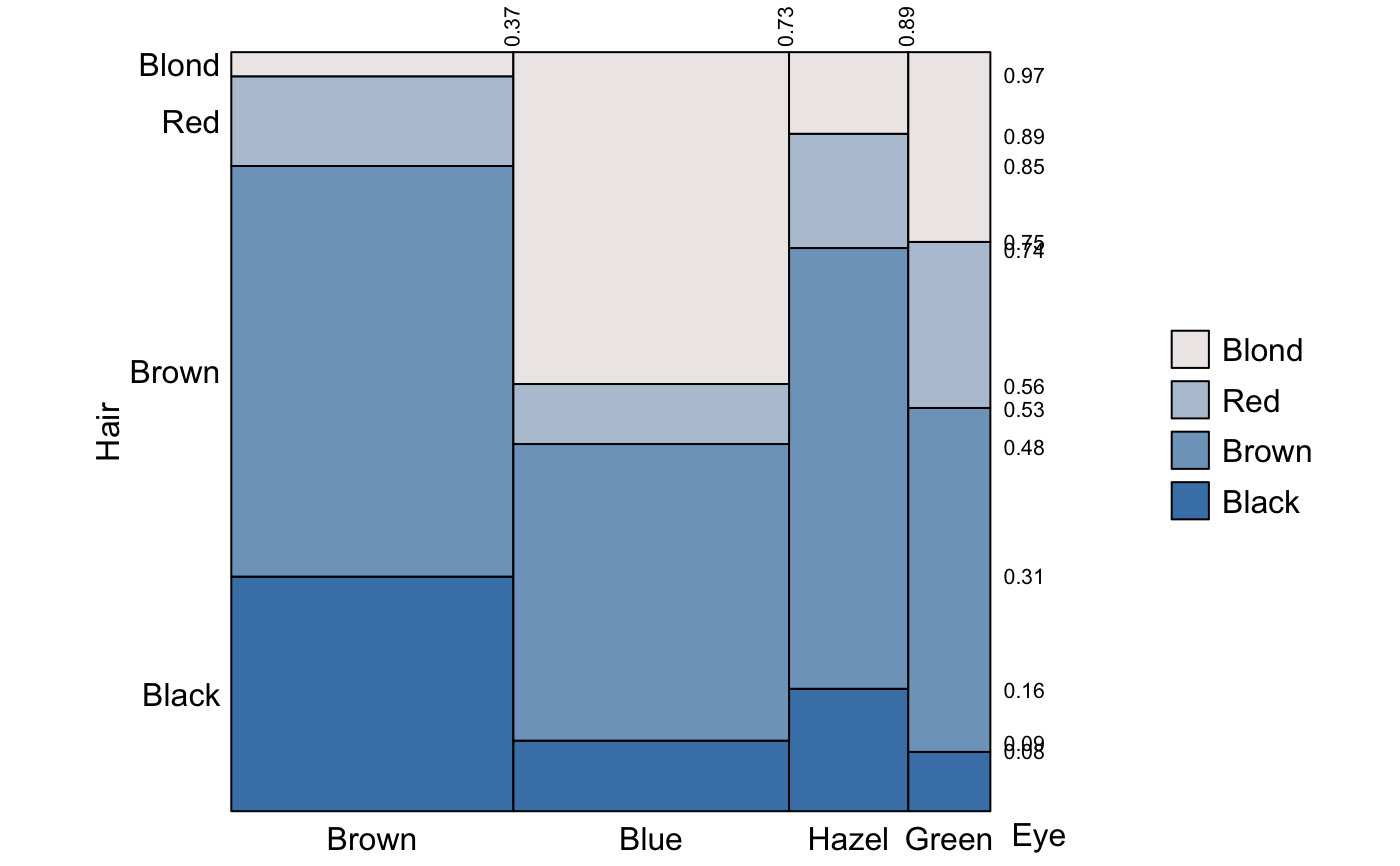
eikos("Hair", "Eye", data=HairEyeColor, legend = TRUE)
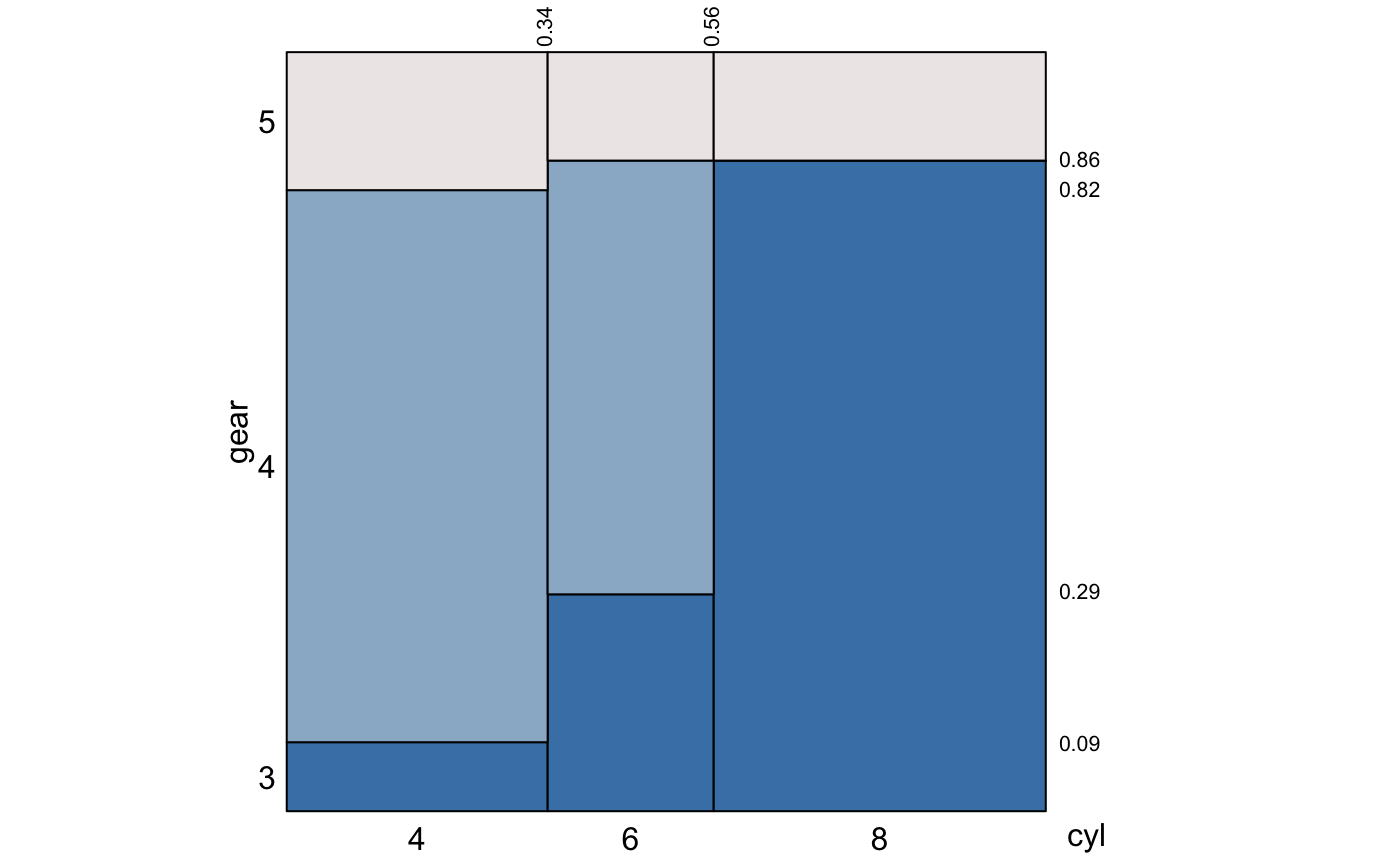
 eikos(gear ~ cyl, data = mtcars)
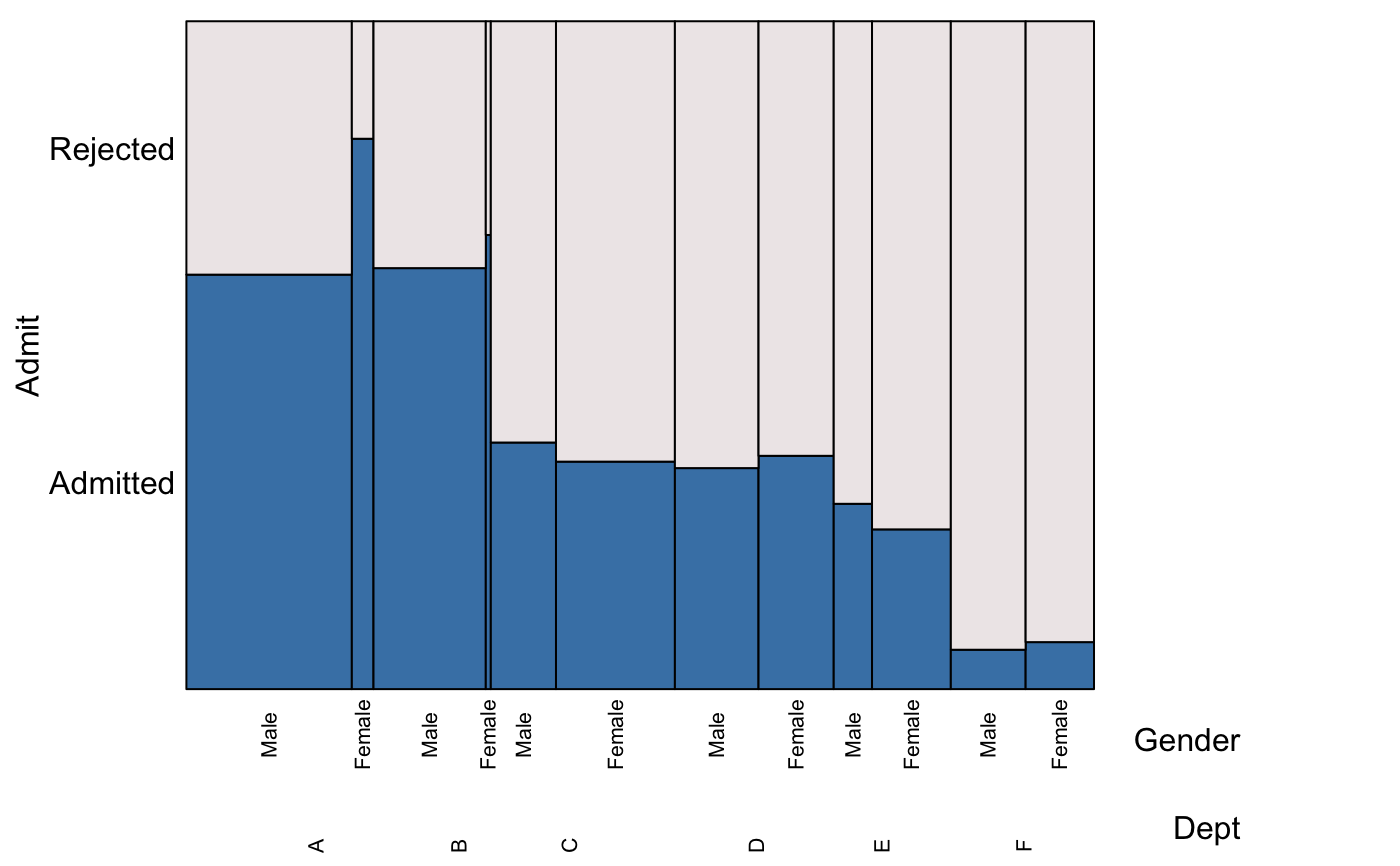
 eikos(Admit ~ Gender + Dept, data = UCBAdmissions,
yaxs = FALSE, xaxs = FALSE,
lock_aspect = FALSE,
xlab_rot = 90, xvals_size = 8,
ispace = list(bottom = 15))
eikos(Admit ~ Gender + Dept, data = UCBAdmissions,
yaxs = FALSE, xaxs = FALSE,
lock_aspect = FALSE,
xlab_rot = 90, xvals_size = 8,
ispace = list(bottom = 15))